BENEFITS

Assessment of Used Vehicles
Reduce the risk of obtaining a vehicle with an engine with poor mechanical integrity. Or if you are selling a used vehicle, use FirstLook® to prove engine mechanical integrity to get top dollar.
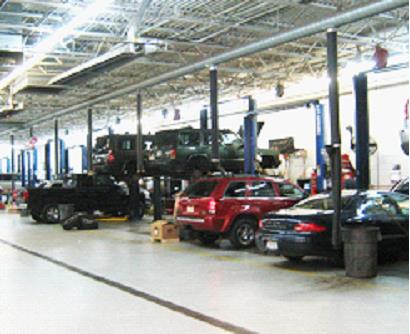
Diagnosis
Faster and more accurate diagnosis with fewer “well, let’s try …” with returns to the shop; less wasted time!
Reduced Total Cost of Ownership
Reduce customer’s cost of ownership by repairing deteriorating components before the big problems develop.
Fuel Economy
Recognize dirty injectors, valves and rings: increase mileage with cleaning additives; increase mileage by spotting more significant valve, ring, and gasket issues and correcting them.
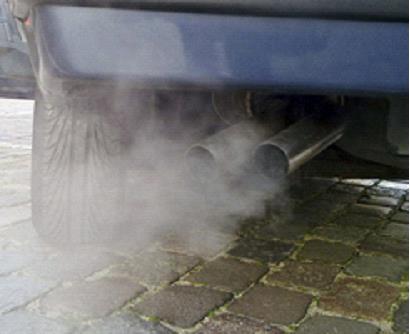
Environmental Quality
Reduced greenhouse & noxious emissions by better combustion & better fuel economy (less fuel burned).
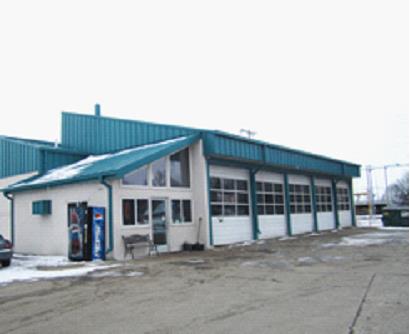
Additives
Oil change franchises want proof to their customers that their engine’s performance would benefit from additives.
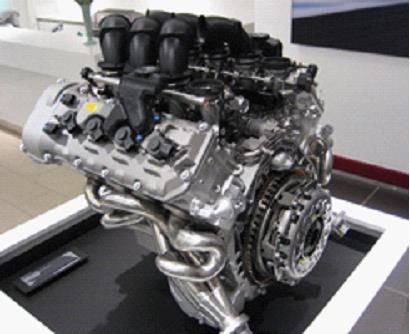
Quality
Verify that repairs have indeed been done correctly and solve the problem before re-installing to vehicle or returning to customer; assess your warranty offers on used vehicles (after rebuild).
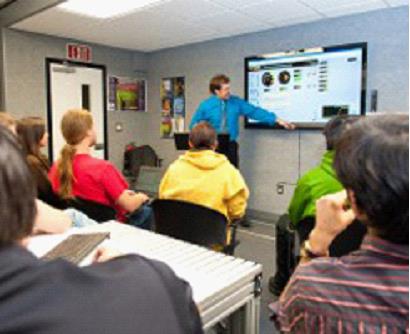
Education
Demonstrate the pulse dynamics of various engine components to students for faster and more complete understanding the workings of internal combustion engines.
Assessment of Used Vehicles
Check a used vehicle engine (gasoline or diesel) for mechanical integrity before you buy it for resale. Don’t waste your money on a used car that has mechanical problems – or reduce the bid to an acceptable level in light of the issues. Mechanical problems cost MUCH more to fix than electrical problems.
With a hand-held oscilloscope & FirstLook®, one can determine the basic integrity of rings, valves, gaskets, and fuel injectors in a few minutes by a power-brake look at the exhaust. FirstLook® at the oil dipstick tube identifies if the engine has ring ‘issues’.
Increase the value of a used car you want to sell by knowing it has mechanical integrity so you can offer a limited warranty. Ten minutes might get you $500 more! A used vehicle engine of high integrity can be warranted – worth at least the cost of warranty insurance.
| VehPur | Number of used vehicles purchased from auction or trade-in (per year) | |
| EngProb | % | Percent of vehicles with engine problem detected by SenX |
| VehCst | Avg. vehicle cost from auction or trade-in | |
| VehOvhd | % | % of vehicle overhead for transportation, Buyer time & travel expenses, time on lot, … |
| VehIns | % | % value increase due to warranty offered due to passing SenX tests |
| CstMny | % | Cost of money per year (%) |
| Value 1 | $ | =VehPur*(1+VehOvhd/100)*VehCst*VehIns/100 = Warranty value increase |
| + Value 2 | $ | =VehPur*(EngProb/100)*VehCst*(1+VehOvhd/100)*CstMny/100 = Money not spent on no-net-value vehicles |
| – Added Cost | $ | =VehPur*(EngProb)*(VehOvhd/100) Had to spend more time to find needed number of good vehicles |
| Total Value | $ |
Diagnosis
Get faster and more accurate diagnosis with fewer “well, let’s try …”s; and fewer returns to the shop! Some tests that normally take 6hrs take only 30 minutes using SenX sensors..
Whether the engine has triggered an OBD code or not, if you have a physical integrity problem, FirstLook® can be used to quickly ’triage’ the engine: fuel or oil additive cleaner is all that is needed? Looks like injectors or fuel system? Looks like a head job? Or pull the engine for crankcase and piston work?
Make the customer more satisfied by fast, accurate diagnosis of mechanical problems.
By attaching a spark plug trigger (inductive pickup or COP probe), one can pinpoint the offending cylinder(s) to better assess the extent of the work required.
Shop Productivity – Less use of mechanic’s time and bay time to perform diagnosis.
| NoVeh | Number vehicles per year with engine problems | |
| BadOBD | % | Percent of vehicles showing bad OBD codes |
| MechRate | $/hour | Mechanic charge for FirstLook triage (Cost per hour) |
| DiagTime | minutes | Time saved diagnosing mech. integrity problem per engine (min) |
| AvdRwk | $/time | Money saved by not chasing bad OBD codes (average $ per incident); savings by eliminating rework |
| Value 1 | $ | =(NoVeh*BadOBD/100)*(DiagTime*MechRate/60) |
| Value 2 | $ | =AvdRwd*NoVeh*(BadOBD/100) |
| Total Value: | $ | = Value1 + Value2 And remember customer good-will! |
Reduce Total Cost of Ownership
Condition Based Maintenance (CBM) results in preventative maintenance on the vehicle when evidence recommends it, preventing catastrophic failure in the field when extraction is expensive and repair very expensive. Personnel inconvenience and casualties are not included in these calculations but are very real, especially in combat situations.
Routine FirstLook check at oil changes can identify failing components.
| FleetSize | Number of vehicles in fleet | |
| RdFailures | % | Cost to rebuild the engine after catastrophic failure |
| CstRdFailure | $ | Extraction, repair, alternative delivery |
| Value | $ | =FleetSize*(RdFailures/100)*CstRdFailure For detecting mechanical problems before they manifest in the field |
Improved Fleet Mileage
Recognize dirty injectors, valves, and rings to achieve gasoline savings by cleaning. Compromised gaskets can also be a cause for loss of fuel economy. These conditions are very visible with the FirstLook® sensors.
Every 200,000 miles, on-road vehicles would get up to 12% mileage improvement by cleaning injectors and cleaning carbon off valves and rings. This steady-state assumes no new vehicles are in the fleet.
| NoVeh | Number vehicles in the fleet | |
| AnnMiles | miles | Annual mileage of the vehicle |
| TstInterval | miles | Interval between tests |
| Dirty% | % | Percentage of vehicles tested that have dirty engine |
| MPG_Avg | mpg | Avg MPG of tested vehicles |
| CleanCst | USD | Cost for additive treatrment |
| MPG_Incr | % | Increase % MPG |
| Fuel$ | $/gal | Cost of fuel/gal |
| Value | $ | =NoVeh*(AnnMiles/TstInterval)*(Dirty%/100)*[(AnnMiles/MPG_Avg)*(MPG_Incr/(100+MPG_Incr)*Fuel$-CleanCst] Cost savings of fuel less cost of additives. |
Environmental Quality
Reduce greenhouse & noxious emissions by better combustion & better mileage (less fuel burned). This can affect the bottom line via annual vehicle testing and penalties for non-compliance. This is most significant for heavy vehicles.
Keeping engines in top condition also reduces NOx, CO and CO2 emissions; this results in reduced time for ‘fixes’ to pass state emissions tests – and possibly reduces cost of fines.
Other benefits include possible income from Carbon Trading and SmartWay compliance supporting investment loans.
Fuel cost elements are not repeated here because that is covered in the Fuel Economy Benefits calculation.
| NoVeh | Number vehicles in the fleet | |
| AnnMiles | miles | Annual average mileage of vehicles |
| Dirty% | % | Percentage of vehicles tested that have dirty engine every 200,000 mi |
| Fines% | % | Percent of dirty engines that get caught |
| FineCst | USD | Cost of typical fine – include driver & equipment down time |
| Value | $ | =NoVeh*(AnnMiles/200000)*(Dirty%/100)*(Fines%/100)*FineCst Reduced Environmental Fines |
Additives and Service Center
In the last decade, the average auto age has gone from 9.8 years to 11.4 years (2002-2013) requiring more aftermarket business.
If your business is routine maintenance of vehicles from the public, you might use SenX evidence of dirty rings and valves to cross-sell additives to clean the engine. In addition, anytime you can show the owner that their engine has a significant problem (or doesn’t have a significant problem), the customer will increase their trust in you.
If evidence shows the condition of dirty injectors or carbon buildup on the valves or rings, many customers will see the benefit of a cleaning treatment.
| NoVeh | Number of vehicles processed per year: | |
| Tst% | % | Percent of customers who will allow you to test their vehicle: |
| Dirty% | % | Percent of tested engines showing dirty engine: |
| Buy% | % | Percent of customers who will buy your cleaner: |
| CleanMargin | $ | Revenue margin of your cleaner/treatment: |
| TstTime | minutes | Time of your technicians to test and sell the additive: |
| TechCst | $/hour | Cost of your technician’s time: |
| Cost: | $ | =NoVeh*(TstTime/60)*TechCst*(Tst%/100) |
| Franchise Value: | $ | =NoVeh*(Tst%/100)*(Dirty%/100)*(Buy%/100)*CleanMargin |
| Net Annual Value to Franchise: | $ | = Franchise Value – Cost |
| AnnMiles | miles | Miles/year driven: |
| Fuel$ | $ | Price of fuel: |
| AvgMPG | mpg | Average fuel economy: |
| MPG_Incr | % | Improvement from treatment (if needed): |
| Mileage: | $ | =((2*AnnMiles)/AvgMPG)*Fuel$*(MPG_Incr/(100+MPG_Incr)) Fuel cost saved in the next two years |
Quality
Verify that repairs have indeed been done correctly and solve the problem before re-installing to vehicle or returning to customer. Ensuring healthy engine quality also yields increased warranty profit on used vehicles (especially after an engine rebuild). A few minutes every time can prevent a few – but very expensive mistakes.
A study * of new marine diesel engines (341 vessels) found that 50% of ‘new’ engines (new, or after rebuild) fail within the first 10,000 hrs of operation (nominal life of 30,000 hours before rebuild); of those, 75% failed due to piston, rings, jacket & liner, exhaust valves, crankshaft & bearings, and FO pump. These failures caused delays of 6941 hrs (110 hr average). Root cause reported was lack of quality control before commissioning.
* INTERNATIONAL COUNCIL ON COMBUSTION ENGINES, Paper No. 95, Analysis of Reliability/Failure of Newly Built Diesel Engines, Akira Kubo et al., CIMAC Congress 2004, Kyoto Reduce cost by detecting inadequate repairs before returning vehicle to customer (or rebuilt engine to vehicle).
| NoEngines | Number of engines rebuilt per year: | |
| ErrRate | % | Percent of engines that are not correctly rebuilt |
| SenXdetect | % | Percent of engine failures that are detected by FirstLook |
| ErrCst | $ | Cost of install, retrieval, rebuild of failed engine |
| Value = | $ | =NoEngines*(ErrRate/100)*(SenXdetect/100)*ErrCst Yearly cost of mistakes |
Educational
Using FirstLook®, students visualise and learn the basic mechanism of the Internal Combustion (IC) engine and the significance of compromised components on its performance. This is equivalent to increased class time of at least 1 credit course, learning more during the educational experience.
It may seem strange to quantify the value of the increased understanding but this aspect is something that has been stressed to SenX Technology from our education clients.
| Students | Number of students graduating from the program | |
| Tuition | $ | Cost per credit hour |
| Value | $ | =Students*Tuition of an additional 1 credit course |
Market Segments (Businesses)
If you service a fleet – or are the manager of a fleet, you may want to look into Engine Angel to store your engine signatures over time and have that system analyse the wear and deterioration of engine components over time. See www.engineangel.com for more information.
Long Haul
Long Haul fleets carry goods around the nation (and across borders) wherever hard surface roads are in place. The flexibility of the modern fleets are fundamental to providing an effective supply chain to and from factory to docks and warehouses. Long distance buses also fall into the category of ‘Long Haul’.
Typically, long-haul vehicles are semis or straight trucks of class 7 or 8 with diesel engines:
- Class 7 Heavy Duty – Weight: 26,001 to 33,000 lb.
Examples: Tow trucks, furniture vans, garbage trucks, straight trucks, medium tractor trailers.
- Class 8 Heavy Duty – Weight: 33,001+ lb.
Examples: Cement mixers, fire trucks, large tour buses, heavy semi tractor trailers.
Automotive
An automotive fleet is assumed to be powered by engines that use spark plugs for ignition of the fuel (as oppose to diesel with compression firing). We consider two types of Automotive Fleets:
- First, a number of vehicles that are owned by a single organization would constitute a fleet. Examples might be taxis, police fleets, government fleets to workers needing to travel on the job, car rentals, etc. The fleet owners might have their own maintenance shop or outsource the maintenance to a 3rd party.
- A second category are vehicles with owners who are very loyal to their maintenance shops, usually the dealership that sold the vehicle.
Automotive fleets have common requirements:
- Maintaining vehicles – routine maintenance and unplanned repairs
- Buying and selling used vehicles
Off-Road
An automotive fleet is assumed to be powered by engines that use spark plugs for ignition of the fuel (as oppose to diesel with compression firing). We consider two types of Automotive Fleets:
Off-Road fleets are usually made up of large, diesel powered vehicles ‘carrying’ heavy loads at low speeds and do not travel far on their own. Equipment in this category include:
- Scrapers, Graders, Back-hoes
- Cranes
- Dump trucks
- Cargo handling (e.g., at ports)
- Mining equipment
Local Haul (Regional Fleets)
Regional fleets often consist of diesel powered vehicles for short-haul delivery of goods or people.
Examples would include:
- School buses
- Municipal buses
- Delivery of goods from distribution centers to retail outlets
Heavy goods of relatively short haul (typically, no sleeping cab on board).
Agriculture
Agriculture equipment for a modern farm might have many engines on various types of equipment:
- Tractors
- Harvesters
- Irrigation pumps
- Backup generators
- Trucks
- Pickups
In the case of a variety of engines, we would treat the entire set of engines under one ‘fleet’, but group the engines according to ‘vocation’ so that engines for a similar vocation will be analyzed together for ranking purposes.
Marine
Various types of vessels:
- Yachts
- Tugboats
- Car ferries
- Cruise ships
These vessels might have more than one engine operating for propulsion at a time.
Railroad
Railroad Engines have many cylinders with multiple cylinders firing at the same time. This is essentially multiple engines working in parallel.
Aircraft
The aircraft that can benefit from SenX’s FirstLook sensors are powered by internal combustion engines. Aircraft engines come in a larger variety of ‘architectures’ than automobile engines (e.g., wheel & spoke circular design, straight or V, etc.), but all have the similar characteristic that, when running well, each 4-stroke cycle produces regular pulses, repeatable for each cylinder.
Stationary
The word ‘fleet’ does not ring true for sets of stationary engines, but much of the analysis and benefits afforded vehicles also apply to such groups of engines.
A typical owner of such engines, usually diesel, has a group with similar work-load.
Examples are:
- Generating stations
- Backup generators (Occasional usage)
- Pumps: Municipal pumps (water or sewage), industrial pumps.
- Pipeline booster pumps
- Sawmills
Military
Although the military employs many diesel engines in its equipment, there are two distinct considerations:
The first is that many military missions are so critical that predictive failure to reduce deployment of high risk equipment into dangerous missions is of high value.
The second noticeable difference is that many military engines are 2-stroke, as opposed to the much more common 4-stroke diesel (and spark-plug) engines in commercial use. The Diesel User Guide describes how to use the FirstLook sensors for 2-stroke engines.


